
Why a Virtual Watershed?

Are you interested to know where the best fish habitat is located?
Or where the largest floodplains are? Are they active or abandoned due to land uses?
Can they be restored?

Where is the highest fire and erosion risk?

Do you know how fire and erosion risk vary across your watersheds?
Where do you target prevention and protection?
Do you have sufficient information to inform pre- or post-fire planning?

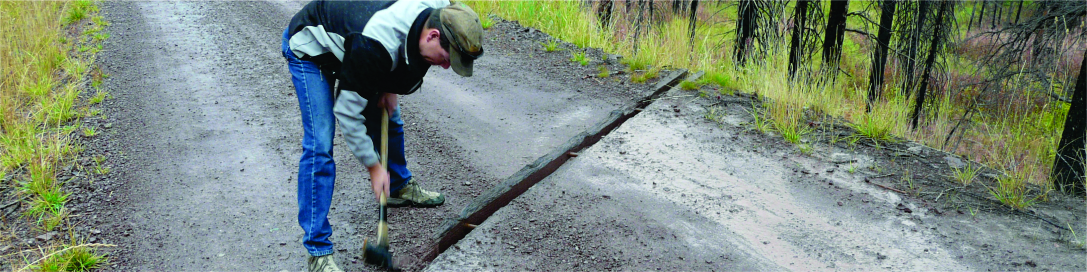
Many watersheds have hundreds of miles of unpaved roads. Roads are considered the largest source of sediment and chemical pollutants.
Of the hundreds of miles, do you know where the most effective places are to reduce sediment?

Do you have the right data and tools in one place to address your questions?
NetMap’s digital virtual watershed can provide the data framework to support numerous applications in natural resource management.
A virtual watershed is more than a stream layer or hydrography. It’s a simulated watershed in a computer that keeps track of different landforms and watershed processes, and many of the connections between them. A virtual watershed can also be used to understand land use effects on watershed processes.
Let’s review the pieces.

We start with the highest resolution digital elevation models and construct a synthetic river network that preserves data at the DEM-pixel scale. This ensures that we can identify things like gradient fish barriers, including waterfalls.
Next, we implement a data structure that allows information in the river network to be transferred upstream, like fish, or downstream, like sediment or thermal load.


And just like in real watersheds, many things are connected to other things. This allows us to connect individual sources of erosion to individual stream segments or individual floodplain segments to specific fish habitats.

Then we discretize the watershed into small slices so we can isolate the linkages between the aquatic and terrestrial landscape.
The local contributing areas to each 100 m reach are called “drainage wings”.
That allows many types of geospatial data to be overlaid onto the terrestrial landscape and be transferred to the channel network.


Landforms are then identified in NetMap’s virtual watersheds and each channel reach contains many relevant attributes to support resource management applications.

Individual channel reaches are assigned a set of stream and watershed attributes that can be used to create new ones, such as fish habitat quality, and channel and landform types.
Ultimately, what we are after is a watershed data platform that can identify important connections in your watershed in support of various types of natural resource management, restoration, hazard mitigation and research.
